How to use Terraform or OpenTofu to Manage Datadog
A simple guide to using Datadog and Terraform

- The Datadog Terraform provider lets you define monitors, downtimes, dashboards, and SLOs as code, authenticating with a Datadog API key and App key.
- Use the datadog_dashboard_json resource with Terraform for expressions to programmatically generate dashboard widgets, since the standard datadog_dashboard resource is not well-suited for dynamic widgets.
- To manage Datadog at scale, use reusable modules, separate state files per environment, and split monolithic state by team, service, or resource type.
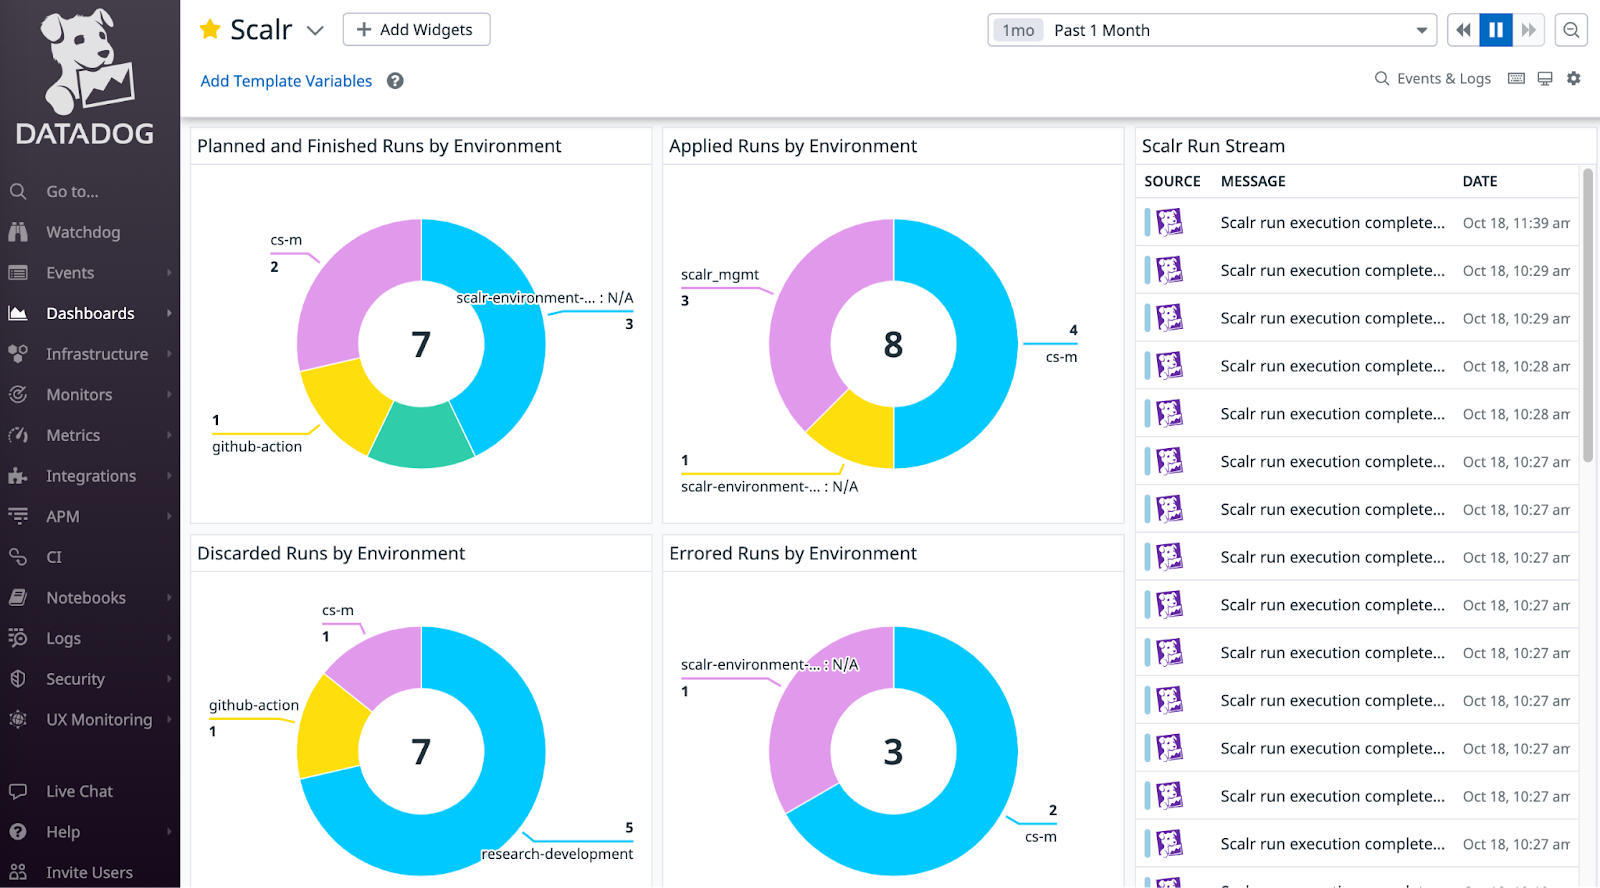
- Scalr provides a built-in Datadog integration that streams run events, sends metrics through the Datadog agent, and forwards all audit logs for analysis.
Datadog is a monitoring and analytics platform that teams use to watch cloud infrastructure and application performance, and to manage incidents when something breaks. Once you have a lot of monitors and dashboards, clicking through the UI to manage them stops scaling. Defining them as code with Terraform or OpenTofu fixes that.
The Datadog Terraform provider lets you define monitoring resources in the same code that provisions your infrastructure. This guide walks through how to use the provider, and then covers the integrations Scalr has with Datadog for monitoring your Terraform runs.
Why Use the Datadog Terraform Provider?
A few reasons to manage Datadog through the provider rather than the UI:
When you define monitoring resources in Terraform configuration files, your monitors and dashboards live in the same codebase as the rest of your infrastructure. They get version-controlled, so changes are reviewed and reproducible. You can automate the provisioning, updating, and deletion of those resources, which cuts down on manual clicking and the errors that come with it. That matters more as your infrastructure grows and managing monitors by hand becomes a chore. And because the Datadog provider works alongside other Terraform providers, you can fold monitoring into the same workflow that provisions, say, an AWS account.
Getting Started
To start using the Datadog Terraform or OpenTofu Provider, follow these steps:
- Install Terraform or OpenTofu: If you haven't already, download and install Terraform from the official website ( https://developer.hashicorp.com/terraform or https://opentofu.org/ ).
- A Datadog account, which can be created here: https://www.datadoghq.com/
- Configure your Datadog API Key: Obtain your Datadog API key from the Datadog dashboard. This key will be used by Terraform to authenticate with Datadog.
- Configure Datadog App Key: Obtain your Datadog App key from the Datadog dashboard. This key will be used by Terraform to authenticate with Datadog.
Using the Datadog Provider: Examples
Define Required Providers and Provider Configuration
Start by configuring the Datadog Terraform provider in your Terraform code. Open your Terraform configuration file (commonly named main.tf) and add the following block:
Replace "your-datadog-api-key" with your Datadog API key and "your-datadog-app-key" with the application keys you generated earlier. The latest version of the official Datadog Terraform documentation can be found in the registry here.
Example: Create a Datadog Monitor
Here's a simple example demonstrating how to create a basic monitor using the Datadog Terraform Provider:
In this example, we define a monitor that triggers when the 5-minute load average on a host named "host0" exceeds 2.0.
Example: Create Downtime
Here's a simple example demonstrating how to set downtime in Datadog using the Datadog Terraform Provider:
Example: Pull a Monitor Datasource
In this example, we'll use the datadog_monitor datasource to pull details about the monitor that was created in a previous step:
This will return details about the monitor such as the message that the monitor has set as well as the thresholds.
Execute Terraform or Tofu Commands
Once you have created your Terraform or Tofu code for the Datadog resources or datasources, you can then execute it with the following commands:
For Terraform:
For OpenTofu:
Terraform or Tofu will initialize the Datadog provider and apply the changes to your Datadog environment. Upon a successful Terraform apply, the state file will be created.
Best Practices and Advanced Usage
Variables and Dynamic Configurations
Use Terraform variables to make your configurations more dynamic. Instead of hardcoding values, use variables to keep your scripts reusable and flexible.
These variables can be defined as environment variables to make it more dynamic and avoid having secrets in the code.
For example, you can specify the following before running the Terraform init to set the Datadog API key:
export TF_VAR_api-key=<your-api-key>
Remote State Management
Store your Terraform state files in a remote backend so they're kept securely. You can set up Scalr or AWS S3 as that backend. Here is an example of connecting to Scalr:
Find out more about remote state management here.
Provider Summary
That covers the basic steps to configure the Terraform Datadog provider. The provider supports a lot more than monitors and downtimes: roles, logs, and integrations with clouds like AWS. The library.tf documentation for the Terraform Datadog provider is a good place to look for those resources and more examples.
Once monitoring lives in your Terraform workflow, it gets versioned, reviewed, and rolled out the same way as the rest of your infrastructure.
Scalr's Integration with Datadog
Scalr, a Terraform Automation and Collaboration platform, provides a built-in integration with Datadog. Scalr is featured in the Datadog catalog, so connecting the two products is straightforward. The sections below cover what the integration sends to Datadog and how to set each part up.
Events
The Scalr to Datadog integration for events can stream event details for Terraform and OpenTofu runs executed in Scalr. Datadog users can build reports based on the source of the run, whether it was from the Terraform CLI, a VCS provider like GitHub, or manually executed through the UI. Users can also track the result of the run, the execution time, and much more.
The events are sent through the Datadog API integration, see the official documentation here.
Metrics
Scalr will send metrics to Datadog for in-depth analysis and reporting such as queued runs, queue state, the number of environments, and workspace count. These metrics are visualized in their out-of-the-box dashboard to help correlate deployments with other infrastructure changes and to track trends within your pipeline. The metrics functionality is an agent-based integration, which means you must use the Datadog agent. See how to install the Datadog agent and enable the Scalr integration here.
Audit Logs
Scalr sends all of its audit logs to Datadog for further analysis. Audit logs allow you to get insights into all actions taken, who performed the action, how it was done, and more. The audit log feature can use the same Datadog connection that is used for events or a new one can be created.
For example, you may want to know how and when a Terraform run was discarded in the Scalr pipeline. Scalr will send the following data to Datadog:
Two ways to use Datadog here
The provider manages Datadog itself, and the Scalr integration lets you watch your Terraform and Tofu runs from inside Datadog. Most teams end up doing both.
For further reading, see our guide to monitoring Terraform runs in Datadog.
Advanced Usage: Dashboards, SLOs, and Resource Mapping
Defining a Dashboard
You can define entire dashboards in code. A common challenge, however, is dynamically generating widgets. The standard datadog_dashboard resource is not well-suited for this.
The solution is to use the datadog_dashboard_json resource, which accepts a JSON string. This allows you to use Terraform's for expressions to programmatically generate your widget definitions.
# variables.tf
variable "widget_configurations" {
  type = map(object({
    title = string
    query = string
  }))
  default = {
    "cpu_usage" = {
      title = "CPU Usage",
      query = "avg:system.cpu.user{*}"
    },
    "memory_usage" = {
      title = "Memory Usage",
      query = "avg:system.mem.used{*}"
    }
  }
}

# main.tf
resource "datadog_dashboard_json" "programmatic_dashboard" {
  dashboard = jsonencode({
    title       = "Programmatically Generated Dashboard"
    layout_type = "ordered"
    widgets = [
      for key, config in var.widget_configurations : {
        definition = {
          type  = "timeseries"
          title = config.title
          requests = [
            {
              q = config.query
            }
          ]
        }
      }
    ]
  })
}
Defining a Service Level Objective (SLO)
SLOs are worth keeping in code so they get reviewed like anything else. This example defines a 99.9% availability SLO based on the ratio of successful API requests to total requests.
resource "datadog_service_level_objective" "api_availability" {
  name        = "API Request Availability"
  type        = "metric"
  description = "99.9% of all API requests should be successful (non-5xx)."

  query {
    numerator   = "sum:trace.http.request.hits{env:prod,service:core-api,!status_code:5xx}.as_count()"
    denominator = "sum:trace.http.request.hits{env:prod,service:core-api}.as_count()"
  }

  thresholds {
    target    = 99.9
    timeframe = "30d"
    warning   = 99.95
  }

  tags = ["service:core-api", "env:prod", "slo:availability"]
}
Scaling Your Datadog Terraform Configuration
As your usage grows, a single monolithic Terraform configuration turns into a bottleneck. Here are a few more practices that help once you're managing Datadog at scale:
- Use Modules: Encapsulate common patterns into reusable modules. For example, create a "standard service" module that bundles monitors for latency, error rate, and saturation. That keeps your setup consistent and cuts down on duplicated code.
- Separate Environments: Use a directory-based structure to maintain separate state files for each environment (e.g.,
dev,staging,prod). This provides strong isolation and prevents changes in one environment from impacting another. - Split Your State: The biggest challenge at scale is a slow, monolithic Terraform state file. Split your state into smaller, more manageable units. Common strategies include splitting by team, by service, or by Datadog resource type. This dramatically improves performance and reduces the blast radius of any single change.
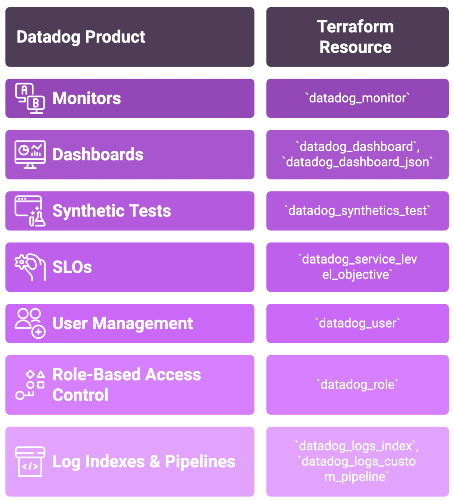
Datadog Product to Terraform Resource Mapping
The following table serves as a quick reference for mapping common Datadog products to their corresponding Terraform resource types.
| Datadog Product | Primary Terraform Resource |
|---|---|
| Monitors | datadog_monitor |
| Dashboards | datadog_dashboard, datadog_dashboard_json |
| Synthetic Tests | datadog_synthetics_test |
| Service Level Objectives (SLOs) | datadog_service_level_objective |
| User Management | datadog_user |
| Role-Based Access Control | datadog_role |
| Log Indexes & Pipelines | datadog_logs_index, datadog_logs_custom_pipeline |
Key Sources
Datadog Provider Documentation: search.opentofu.org/provider/datadog/datadog/latest/docs
Datadog API Documentation: docs.datadoghq.com/api/latest/
Terraform Documentation: developer.hashicorp.com/terraform/docs
OpenTofu Registry (Datadog Modules): search.opentofu.org/modules?query=datadog
Datadog Provider GitHub Repository: github.com/DataDog/terraform-provider-datadog
Frequently asked questions
Why manage Datadog with Terraform instead of the UI?
Defining Datadog monitors and dashboards in Terraform puts them in the same version-controlled codebase as the rest of your infrastructure, so changes get reviewed and are reproducible. It also automates provisioning, updating, and deleting those resources, which cuts down on manual clicking and the errors that come with it as your monitor count grows.How do you authenticate the Datadog Terraform provider?
The Datadog Terraform provider authenticates with two credentials from your Datadog dashboard: an API key and an App key. To avoid hardcoding secrets, pass them in as Terraform variables set through environment variables, for example export TF_VAR_api-key=<your-api-key> before running terraform init.How do you create dynamic Datadog dashboards with Terraform?
The standard datadog_dashboard resource is not well-suited for dynamically generated widgets. Use the datadog_dashboard_json resource instead, which accepts a JSON string, so you can use Terraform for expressions to programmatically generate widget definitions from a variable of widget configurations.What are best practices for managing Datadog with Terraform at scale?
Encapsulate common patterns into reusable modules, such as a standard service module bundling latency, error rate, and saturation monitors. Keep separate state files per environment using a directory-based structure, and split a monolithic state by team, service, or Datadog resource type to improve performance and reduce blast radius.
Terraform Providers: Complete Configuration and Management Guide
Learn about what Terraform providers are and how to use them with examples.