A Guide to Terraform Audit Logs
Why are Terraform audit logs essential? What should they contain? How can they help with monitoring and workflow automation?

- Audit logs need to be an append-only history, not a current-state report. A usage report that only reflects the latest run can lose evidence of a malicious module within minutes of the next workspace update.
- Auditors typically request several months of login events, both successful and failed, plus administrative actions like permission changes, exported in CSV or JSON. Capture these from day one; you cannot backfill events you never recorded.
- Streaming audit logs to Datadog or AWS EventBridge is not the same as retention. If the streaming pipeline goes down, you need an export or backfill path to recover the gap.
- A complete Terraform audit log covers authentication events, administrative changes, variable and state access, and run lifecycle events, each with a timestamp, the acting user, and a source IP address.
- Terraform itself does not provide a centralized, persistent audit log of user and administrative activity. Scalr generates one automatically and streams it to Datadog and AWS EventBridge as part of its Enterprise tier.
If you run Infrastructure as Code (IaC), you need a clear record of who changed what. Terraform audit logs give you that immutable record, detailing every action that affects your infrastructure. Managing these logs well is fundamental to a secure and compliant Terraform practice.
This guide explains why Terraform audit logs are essential, what information they should contain, and how you can use them for centralized monitoring and to power event-driven workflows.
Why Your Organization Needs Terraform Audit Logs
A complete audit trail answers who, what, and when for every change. Without a reliable system for Terraform audit logs, you're exposed to security, compliance, and operational risks.
Security and Incident Response
In the event of a security incident, Terraform audit logs are your primary source of truth. They provide a detailed timeline of events, enabling security teams to trace the origin of a breach, understand the scope of unauthorized changes, and identify the responsible party. For example, if a sensitive variable is accessed or a security group is modified, the audit log will show precisely which user or service account initiated the action, from what IP address, and at what time.
The distinction that matters here is append-only history versus current state. In May 2026, the security team at one enterprise we work with at Scalr was threat-hunting for supply-chain attacks delivered through malicious Terraform modules. They started with provider and module usage reports, then discovered those reports only reflect each workspace's most recent run: a module that appeared in the report at 8:50 AM was gone nine minutes later, after the workspace ran again with an updated configuration. Their conclusion, verbatim: "If there were an incident… we don't have a source of truth for us to search." A current-state report tells you what your infrastructure uses now; only an append-only audit log can tell you what it used at the moment of compromise.
Meeting Compliance Requirements
Many regulatory frameworks like SOC 2, HIPAA, and PCI DSS have strict requirements for logging and auditing. To pass an audit, you must be able to prove that all changes to your infrastructure are tracked and authorized. Terraform audit logs serve as the definitive evidence to satisfy auditors and demonstrate that you have control over your production environment.
What auditors actually ask for is more specific than the frameworks suggest. In May 2026, a customer preparing for a security review needed four months of records, January 1 through April 22, covering login and access events (both successful and failed authentication) plus every administrative action: configuration changes, permission modifications, and account and user management. The auditor wanted it in CSV or JSON, in the "most detailed format available." That request shape comes up constantly in Scalr's support queue, and it has a corollary: the question about retention limits tends to arrive late. One customer, already mid-audit, asked Scalr support for twelve months of logs and only then asked what the retention window was. Confirm your retention horizon before the auditor does.
Operational Stability and Troubleshooting
When a deployment fails or an application experiences an outage, the first question engineers ask is, "What changed?" Terraform audit logs provide a clear history of all recent activities, allowing teams to quickly correlate a change with a problem. This significantly reduces mean time to resolution (MTTR) and helps prevent similar issues in the future by understanding the root cause.
What to Capture in Terraform Audit Logs
A useful audit logging system for Terraform has to capture more than just run events. For complete visibility, your Terraform audit logs should cover a lot of activity across the platform. The key events to capture:
- User and Authentication Events: Logins, logouts, and failed authentication attempts.
- Administrative Changes: Modifications to workspaces, environments, user permissions, and VCS provider settings.
- Variable and State Access: Creation, updates, and deletions of variables (especially those marked as sensitive).
- Run Lifecycle Events: Run creations, approvals, denials, and cancellations.
- Object Creation/Deletion: Events for when workspaces, environments, or other resources are created or deleted.
Each log entry must contain sufficient context, including a timestamp, the user who performed the action, their source IP address, and a detailed message describing the event.
Which Terraform Cloud tier includes audit logs?
On HCP Terraform (formerly Terraform Cloud), audit trails are available in the Standard and Premium editions. The entry-level Essentials edition does not include them, and HashiCorp's documentation notes that the Audit Trails API is not available for self-managed Terraform Enterprise. On Scalr, audit logs are part of the Enterprise tier. On either platform, a centralized, persistent audit log is a higher-tier capability rather than something the free or entry tier provides by default.
That gating matters for planning. If a compliance framework or a pending security review requires an exportable history of logins and administrative changes, the tier you are on decides whether you can produce it at all. Confirm that audit logging is included before you assume it is, because you cannot backfill events that were never recorded. As of June 2026, the practical takeaway is the same on both platforms: budget for the tier that turns audit logging on, and verify the retention window that comes with it.
How Scalr Provides Comprehensive Terraform Audit Logs
Terraform performs the actions, but it doesn't give you a centralized, persistent audit logging system that captures the full range of user and administrative activity. That's where a platform like Scalr comes in. Scalr is built around auditing, and it captures every event that happens on the platform.
Scalr automatically generates detailed audit logs for all the critical events, from user logins to variable creation and run approvals. You can stream these logs to external logging platforms for administrators and security teams to consume. Audit logs and audit log streaming are part of Scalr's Enterprise tier; if compliance evidence is on your roadmap, plan for that when choosing a plan.
Centralizing Terraform Audit Logs
For enterprise-wide security monitoring and operational visibility, Terraform audit logs must be integrated with your existing observability and event management platforms. Centralizing these logs allows your teams to correlate infrastructure changes with events from other systems and apply their established monitoring, dashboarding, and alerting rules.
Scalr provides direct integrations to stream audit logs and events to leading cloud platforms.
One caveat from production experience: streaming is delivery, not retention. When a major cloud outage took down one customer's log pipeline in October 2025, their streaming destination stopped receiving events for roughly two days, October 19 through 21, and they came to Scalr needing that window backfilled. If your compliance posture depends on an unbroken log, treat the streaming integration as one leg and keep an export or backfill path as the other. The same lesson applies after deletions: one team came to Scalr after deleting a workspace, needing the run history that went with it. Logs you have already exported survive the resources they describe.
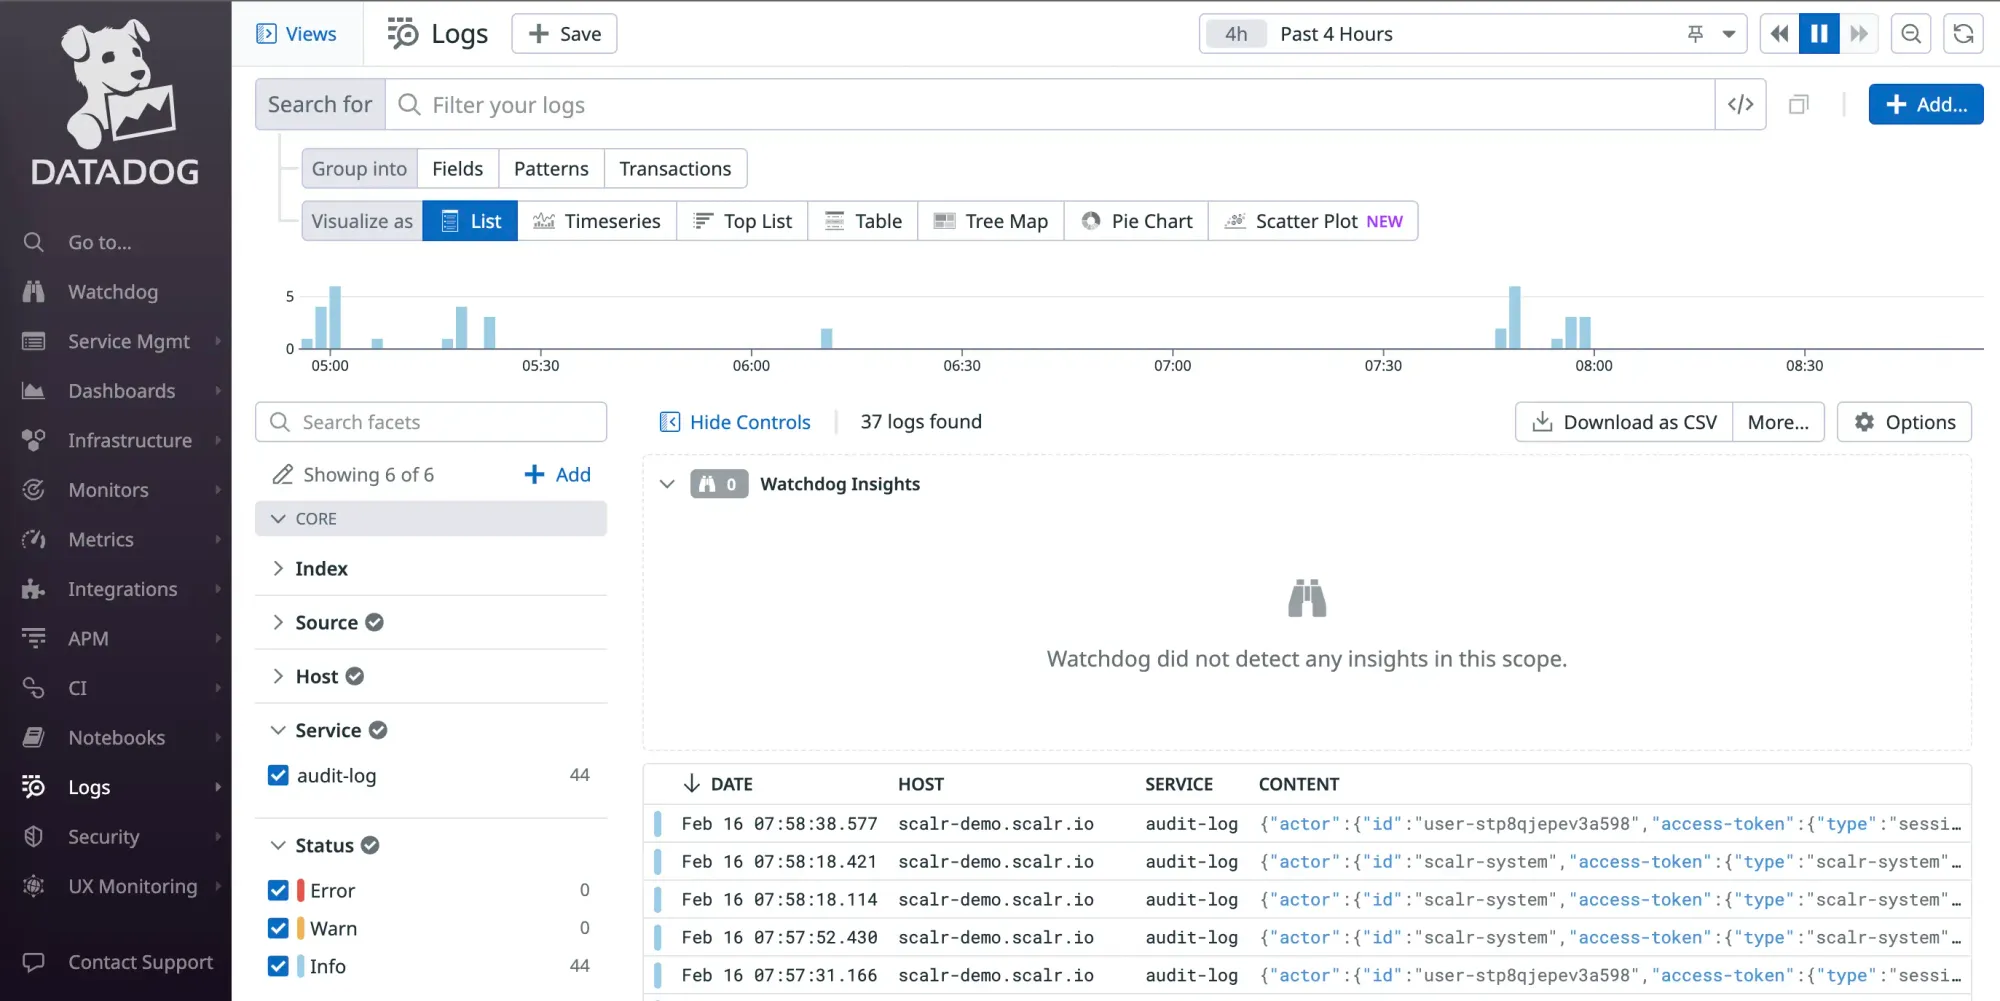
Sending Audit Logs and Events to Datadog
Scalr can send audit logs directly to Datadog Logs. This allows you to unify your Terraform audit logs with application, security, and other infrastructure logs already being collected in Datadog. Once in Datadog, you can use its powerful search, analytics, and visualization features to create dashboards that track key Terraform activities, monitor for specific security events, and set up alerts on suspicious behavior.
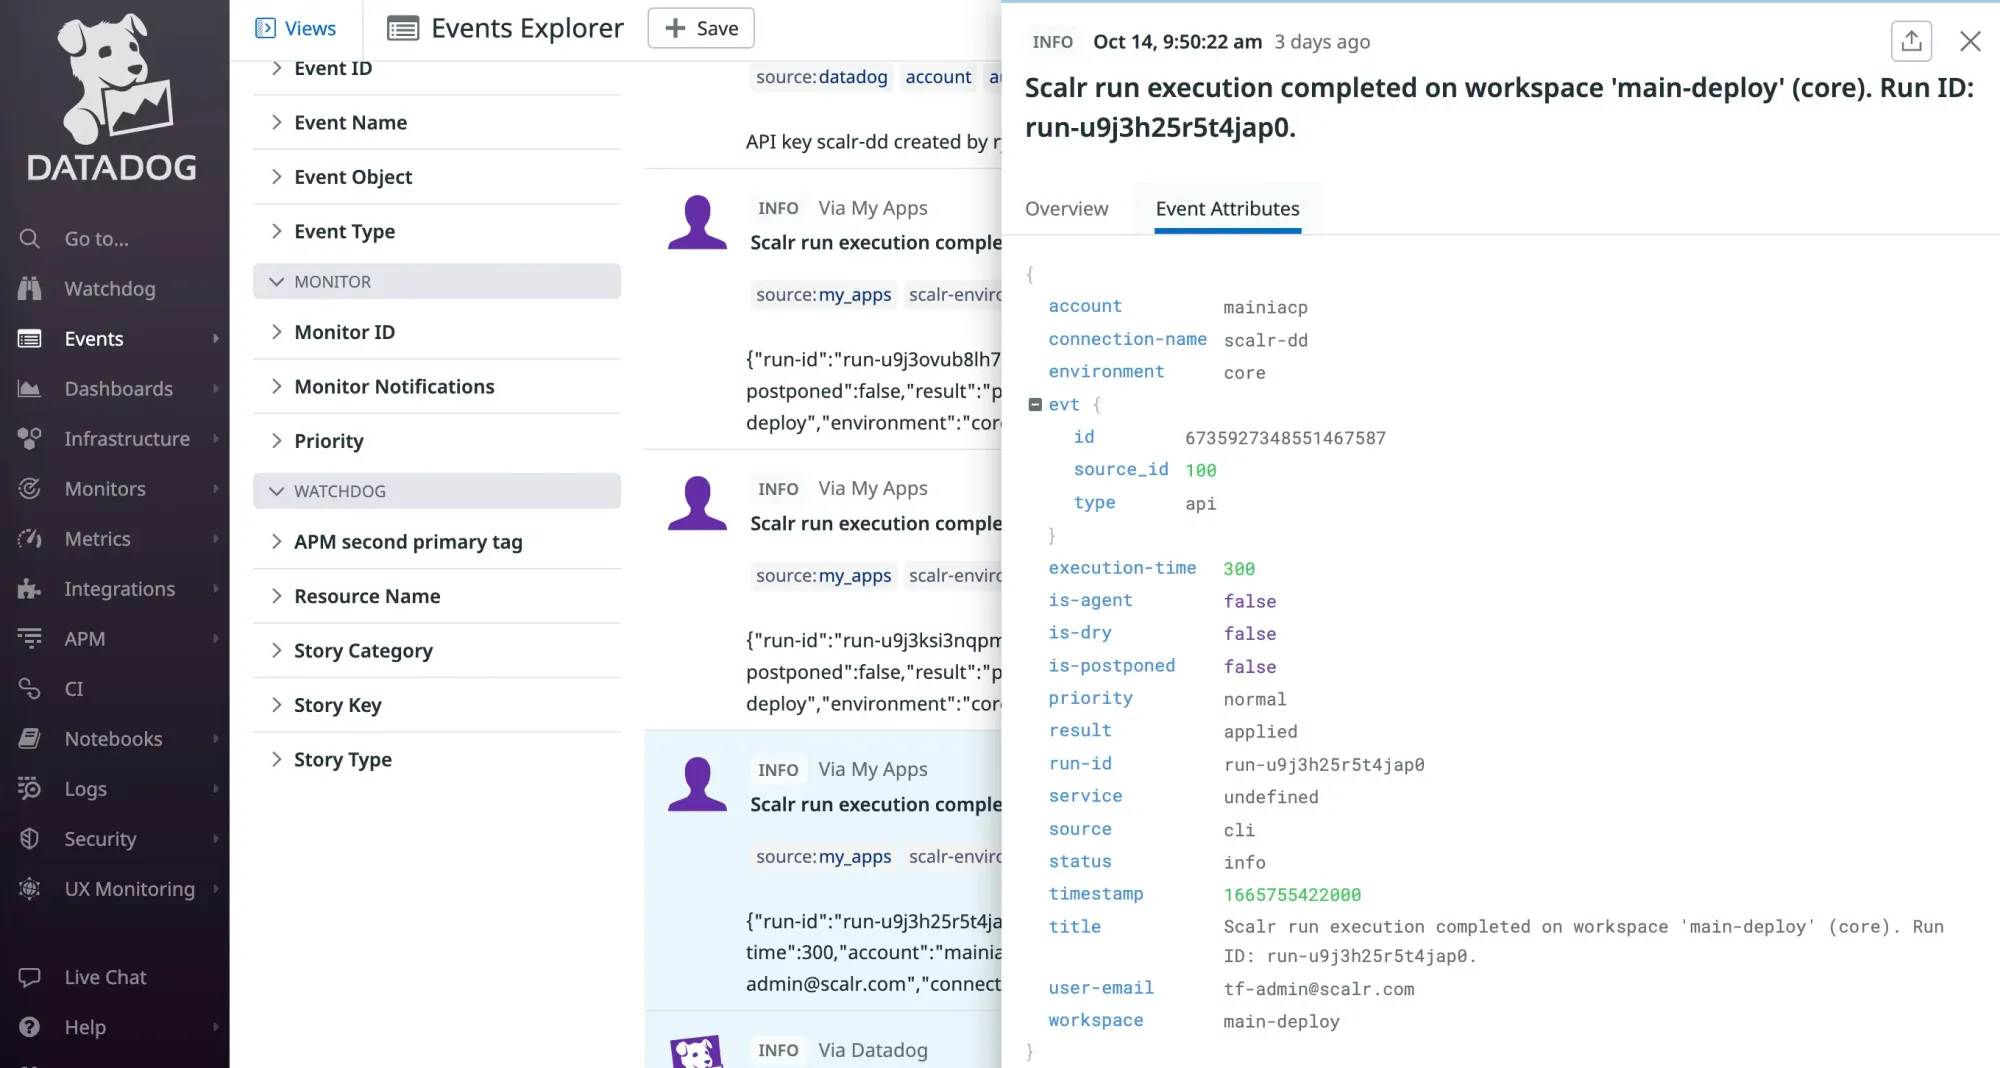
Scalr also sends events to Datadog, such as when a run errored, how the run was executed, and when. While these details are similar to audit logging, they can also be used for monitoring and alerting in event-driven workflows, as seen below.
See the official docs on how to set up the integration with Datadog here.
Sending Audit Logs and Events to AWS Eventbridge
Scalr also sends the same audit log details to AWS Eventbridge. This integration gives users the flexibility of forwarding it to any third-party tool that Eventbridge integrates with or to another service in AWS, such as CloudWatch.
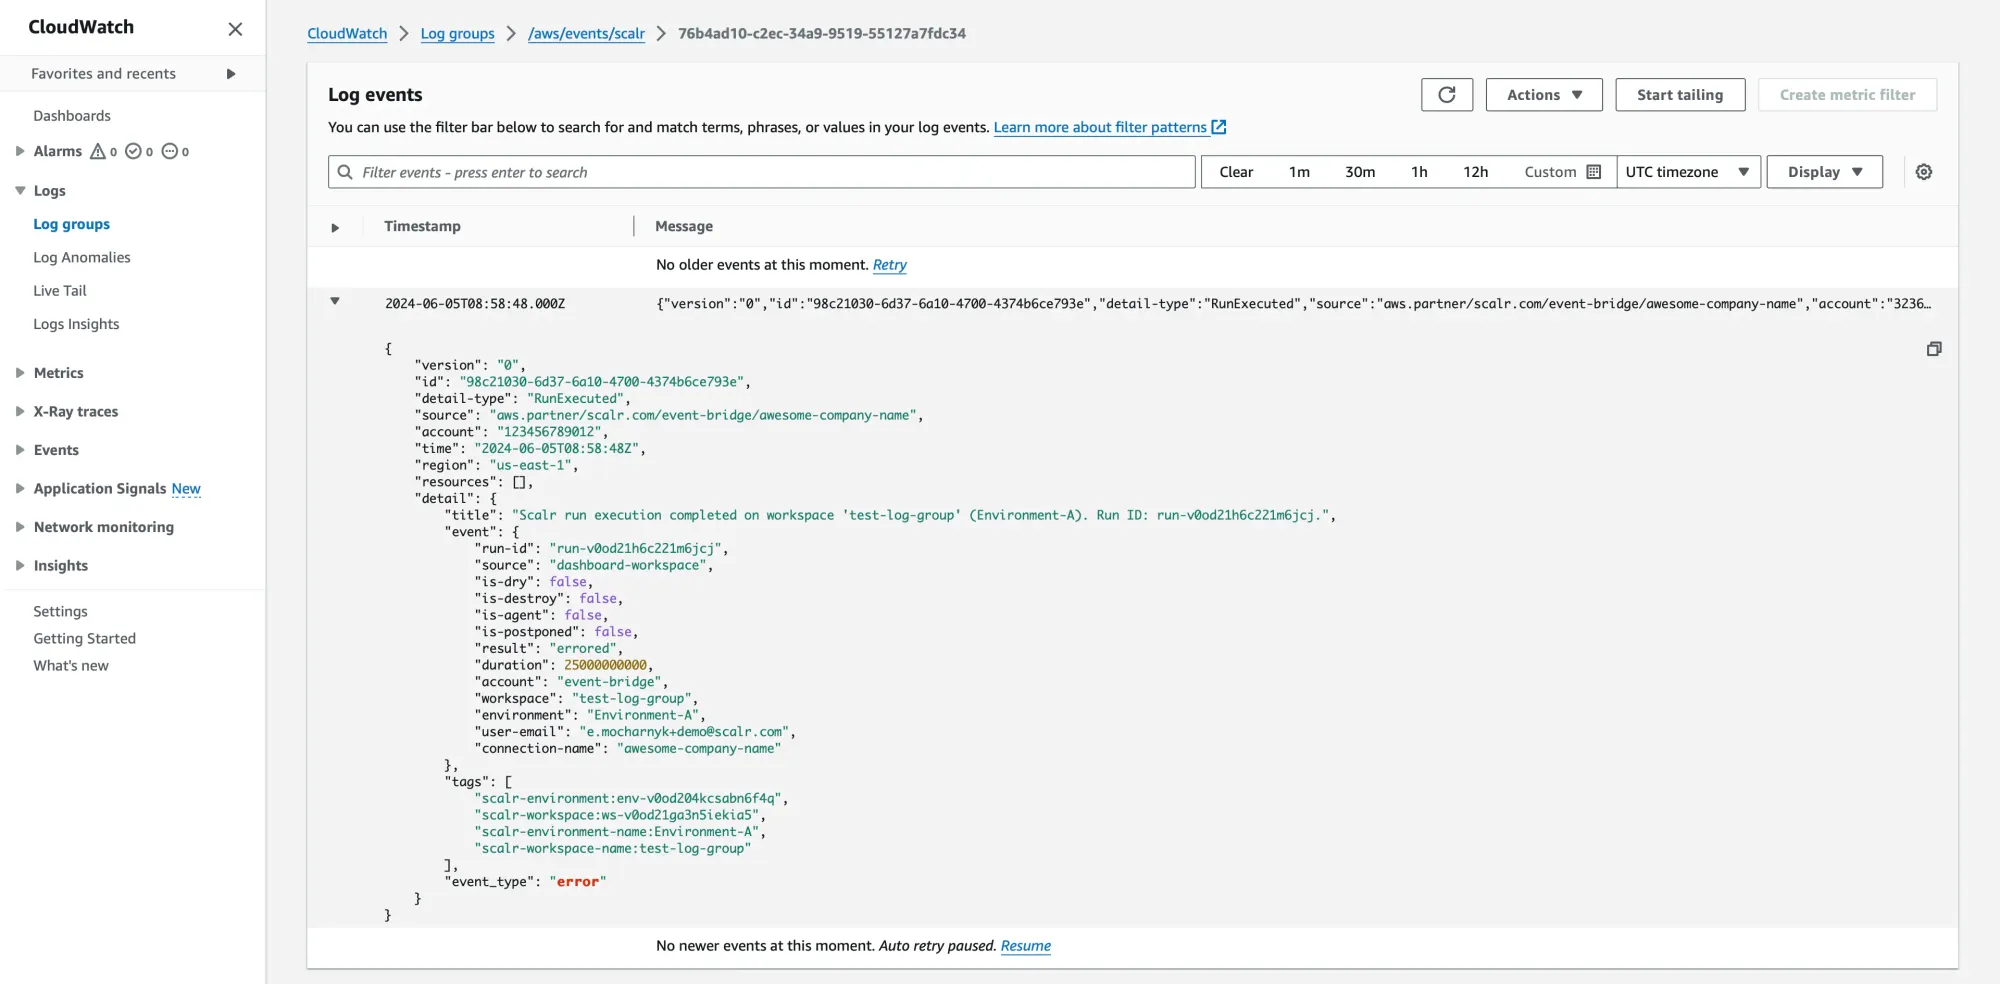
For more than just logging, Scalr also sends events directly to an Amazon EventBridge event bus. This integration is designed for action, turning an event into a trigger. Scalr sends two event types, RunExecuted for run lifecycle and AuditLog for audit events, plus an AuditLogDisabled alert if streaming stops, which you can then use to invoke all sorts of AWS services.
See the official docs for the Scalr integration with AWS Eventbridge here.
Using Terraform Audit Logs for Event-Driven Workflows
The real power of modern audit logging comes from using events to drive automated workflows. By streaming events from Scalr to AWS EventBridge, you can move beyond passive monitoring and build active, automated systems that respond to infrastructure changes in real time.
When Scalr sends an event to your EventBridge event bus, you can create rules that filter for specific events and route them to targets. This enables powerful automation, such as:
- Triggering an AWS Lambda function when a
RunExecutedevent arrives with a completeddetail.statusfor a production environment. The function could create a change ticket in Jira, post a custom summary to a Slack channel, or run a post-deployment validation script. - Starting an AWS Step Functions workflow when an
AuditLogevent is detected with a workspace-creationdetail.event. This could orchestrate a series of compliance checks, apply a standard set of policies, and notify a platform administrator that a new workspace is ready for review. - Sending a notification via Amazon SNS when a
RunExecutedevent arrives with an errordetail.status. This can be used for customized email, SMS, or PagerDuty alerts that go beyond standard notifications.
When you route the events from your Terraform audit logs into AWS EventBridge, the same data that proves what happened can also trigger what happens next, so a workspace creation or a failed run kicks off the right ticket, alert, or check automatically.
A note on plan tiers: at Scalr, audit-log streaming and export sit in the Enterprise plan. Check pricing and the pricing FAQ for current gating before you design an integration around it.
Frequently asked questions
What should Terraform audit logs contain?
A complete Terraform audit log captures user and authentication events (including failed logins), administrative changes to workspaces and permissions, variable and state access, run lifecycle events, and object creation or deletion. Each entry needs a timestamp, the user who performed the action, their source IP address, and a detailed event description.Why are Terraform audit logs important for compliance?
Frameworks like SOC 2, HIPAA, and PCI DSS require you to prove that all infrastructure changes are tracked and authorized. In practice, auditors ask for months of login and administrative events in an exportable format such as CSV or JSON, so the logs serve as the definitive evidence during a security review.Does Terraform itself provide audit logs?
No. Terraform executes changes but does not provide a centralized, persistent audit logging system that captures user logins, permission changes, variable access, and run approvals. A management platform such as Scalr generates these logs automatically for every event on the platform.Can I stream Scalr audit logs to Datadog or AWS?
Yes. Scalr streams audit logs and run events directly to Datadog Logs and to an Amazon EventBridge event bus, where they can be forwarded to CloudWatch or any EventBridge-integrated tool. Audit log streaming is part of Scalr's Enterprise tier.Is streaming audit logs to an external platform enough for retention?
No. Streaming only delivers events while the pipeline is healthy. During the October 2025 AWS outage, one customer's streaming destination stopped receiving events for roughly two days, and they needed that window backfilled. Treat streaming as delivery and keep a separate export or backfill path for retention.Which Terraform Cloud tier has audit logs?
On HCP Terraform (formerly Terraform Cloud), audit trails are available in the Standard and Premium editions; the entry-level Essentials edition does not include them, and HashiCorp's documentation notes that the Audit Trails API is not available for self-managed Terraform Enterprise. On Scalr, audit logs (including streaming to Datadog and AWS EventBridge) are part of the Enterprise tier. On both platforms, a centralized, persistent audit log is a higher-tier feature rather than a free-tier default.
IaC Security: Securing Your Terraform and OpenTofu Infrastructure
Comprehensive guide to securing Terraform, covering threat modeling, state file security, secret management, static analysis tools, DevSecOps practices, and best practices for 2026.