
Article · part of a guide
Terraform Observability: Metrics, Logs, and Audit Trails Explained
What Terraform observability covers across a workspace fleet: run metrics, reports, Prometheus and Datadog export, tracing, AI-assisted troubleshooting, and audit trails.
Key takeaways
- Terraform observability spans more than run health and drift: fleet-wide resource inventory, workspace activity, module/provider/version freshness, credential hygiene, and audit trails of who changed what all count as signals.
- Scalr's Metrics page tracks run health natively (duration trends, queue and approval wait time, slowest workspaces); its Reports cover what's deployed (drift, stale workspaces, versions, modules, providers, API tokens).
- Scalr exposes account metrics in the OpenMetrics text format (Prometheus-compatible) and separately sends current-state (not historical) metrics and run events to Datadog.
- Scalr's Audit Logs are an Enterprise-tier feature: immutable records of user and system activity, streamed in real time to Datadog or AWS EventBridge, or exported to your own cloud storage every 24 hours.
- Scalr AI explains errored runs and summarizes plans for approvers (recommendations only, no auto-fixes); the Scalr MCP Server lets an AI assistant query runs, drift, and usage data across the fleet in plain language, mostly read-only.
- Distributed tracing for Terraform runs is still early: OpenTofu shipped experimental OpenTelemetry tracing in 1.12, and Scalr's self-hosted agents export OTLP spans to any OpenTelemetry collector, including Jaeger.
A single terraform plan tells you what one workspace will do next. It tells you nothing about whether last night's scheduled apply across 200 other workspaces succeeded, whether three of them are stuck in a queue, or whether someone made a change outside Git two weeks ago that nobody's noticed yet. Terraform observability closes that gap by applying the same metrics/logs/traces thinking teams already use for application monitoring to the infrastructure pipeline itself.
What Is Terraform Observability?
Observability, in the general sense, is usually broken into three signal types: metrics, logs, and traces. Mapped onto a Terraform or OpenTofu fleet, that turns into a shorter, more concrete list: how healthy your runs are (success rate, duration, how long things sit in a queue), whether live infrastructure still matches what's in Git and state (drift, covered in depth in its own guide rather than here), whether your modules, providers, and Terraform or OpenTofu versions are current across the fleet, whether every workspace with live resources is still being run, and a record of who changed what. None of this exists by default in the open-source CLI. terraform plan and terraform apply are workspace-scoped and stateless between invocations, so there's no fleet view, no historical trend, and no notification unless you build one yourself. Observability is what a platform layered on top adds.
Why Does Terraform Observability Matter at Scale?
At a handful of workspaces, a Slack message and a shared dashboard cover most of this. The problems show up as the fleet grows: a scheduled run fails in a workspace nobody's watching, and the next person to notice is whoever needed the change that didn't happen; apply durations creep up over months with nothing to point at beyond "it feels slower lately"; concurrent run limits get hit mid-deploy and the first sign of trouble is an engineer asking why their plan has been pending for twenty minutes; an auditor asks who approved a production change six weeks ago, and the answer lives in someone's memory instead of a log. None of these are exotic failures. They're the ordinary cost of running infrastructure pipelines with no visibility into the pipeline itself, and the cost scales with workspace count.
How Does Scalr's Metrics Feature Cover This?
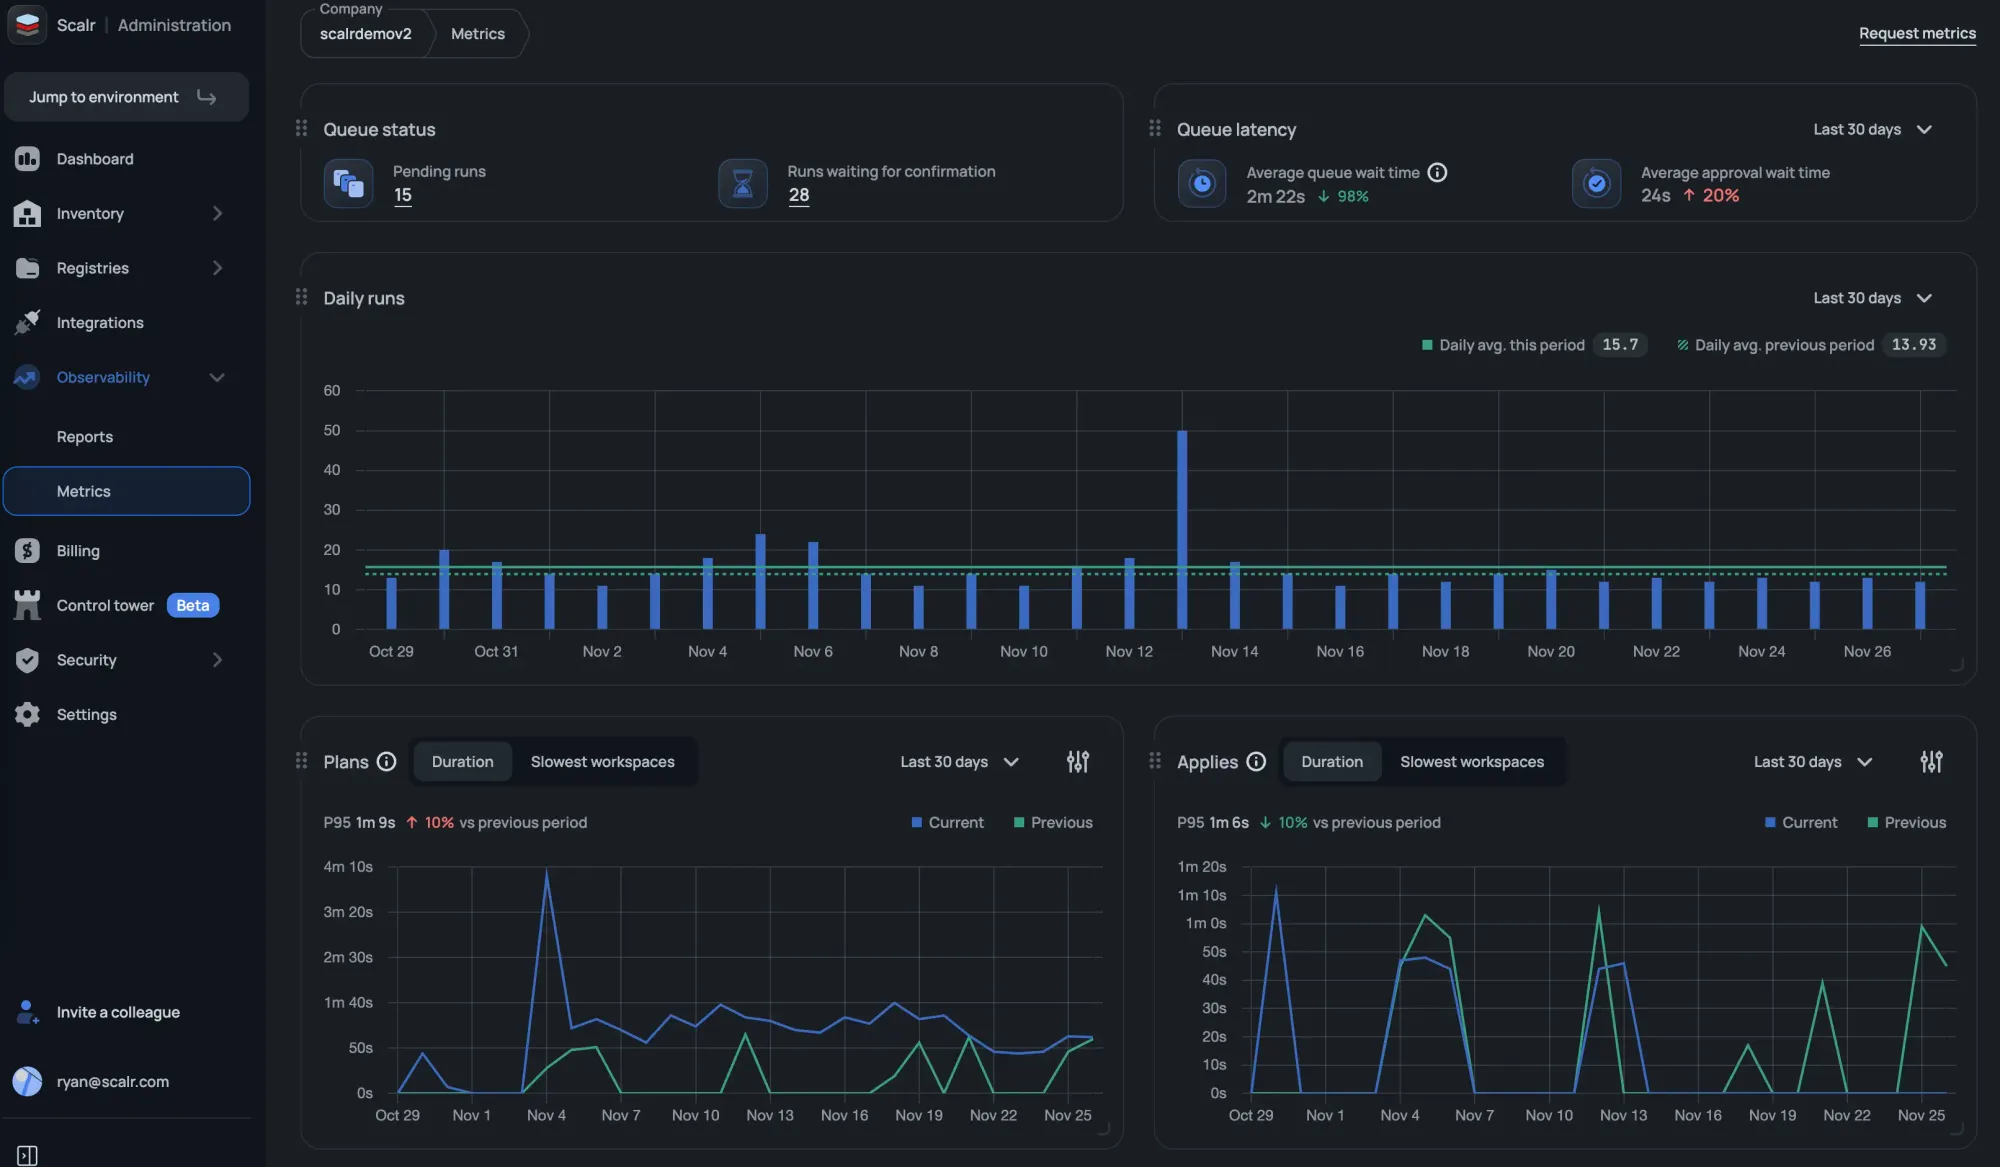
Scalr's account-level Metrics page tracks most of the run-health side of this natively, without any external tooling:
- Run success rate, plan-only rate, and self-hosted agent usage.
- Apply duration trends and plan duration trends, each viewable over 7, 30, or 90-day windows.
- The slowest workspaces by apply time and by plan time, so a fleet-wide average can't hide one workspace dragging everything down.
- Daily run counts, pending runs, and runs waiting for confirmation.
- Average queue wait time and average approval wait time.
You can filter out non-production environments and toggle the aggregation window for the duration trends, and none of it requires exporting anything to a third-party tool first; it's the default view at the account or environment scope. Introducing Scalr Metrics covers the feature in more depth.
How Do Scalr's Reports Add Observability?
Metrics tell you how runs are performing; Reports tell you what's actually deployed and where the risk is concentrated. They live at the account or environment scope:
- Versions Report: which Terraform or OpenTofu version every workspace's state file is on, with a dry-run compatibility check before you upgrade.
- Modules Report and Providers Report: what's in use across the fleet and which workspaces are behind.
- Resources Report: a rollup of every resource across every state file, including recently deleted ones, with drill-down to the run that touched them.
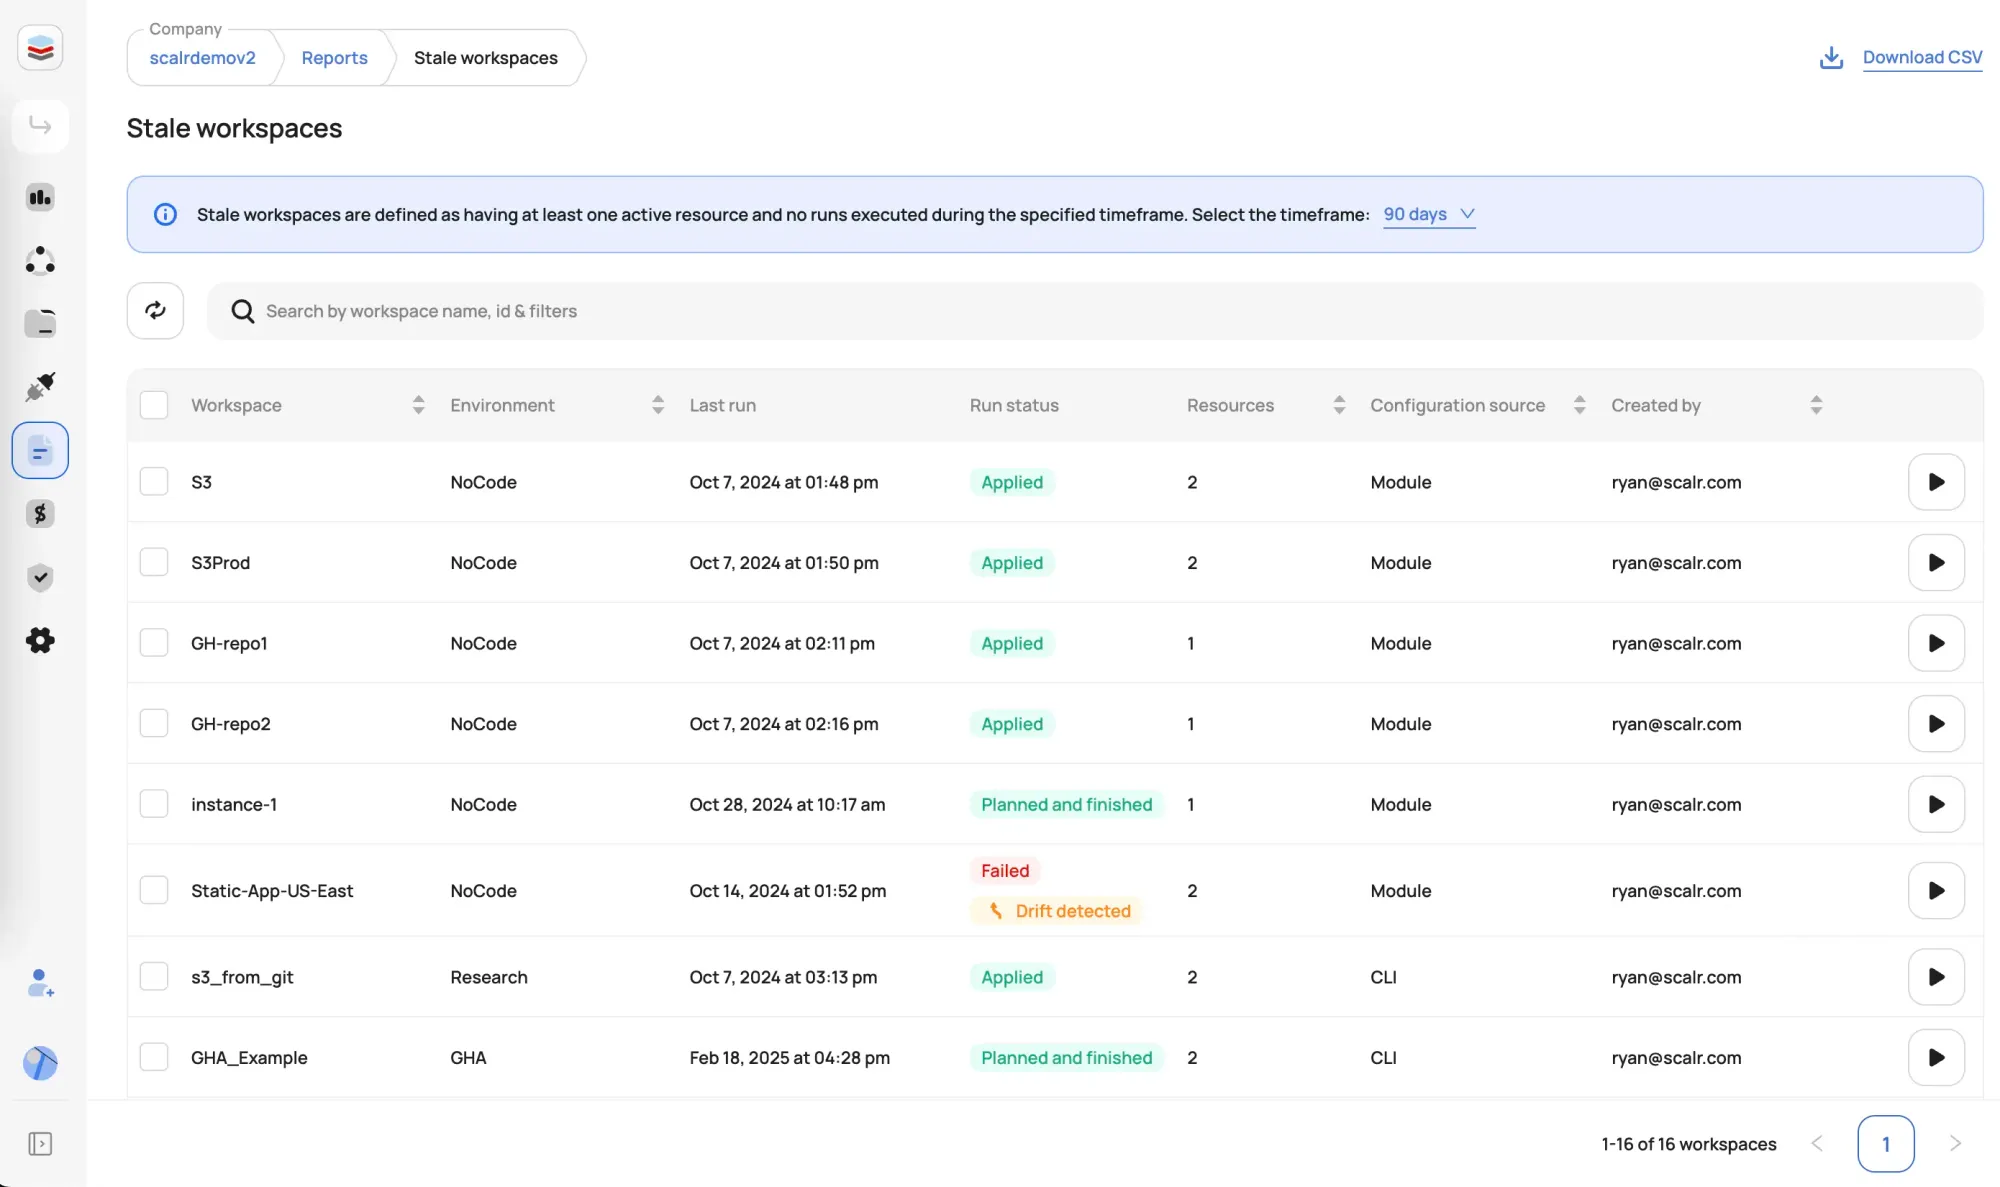
- Stale Workspaces Report: workspaces that haven't run within a window you set, with a button to trigger a run directly.
- Drift Report, at the environment scope: last and next drift-check time and status. Full mechanics are in the drift detection guide.
- API Tokens Report: flags credentials that haven't rotated or haven't been used.
- Billing: usage broken down by environment and workspace, counting only billable runs.
- AI Audit Log: a record of every interaction with Scalr AI.
Each report drills down from the summary to the workspaces behind a number, so the fix happens where the outlier is.
How Do You Get Terraform Metrics Into Prometheus or Datadog?
If you already run a Prometheus/Grafana or Datadog stack for application monitoring, you'll want Terraform metrics in the same place rather than a separate dashboard nobody checks.
Scalr exposes account metrics in the OpenMetrics text format (the open, Prometheus-compatible standard) at a per-account endpoint. Exposed gauges include scalr_runs_count, scalr_runs_failed, scalr_runs_successful, scalr_runs_concurrency, scalr_runs_queue_size, scalr_runs_awaiting_confirmation, scalr_quota_max_concurrency, scalr_environments_count, scalr_workspaces_count, and several billing-related gauges. Any Prometheus-compatible scraper, including Prometheus itself or a Datadog Agent OpenMetrics check, can pull from that endpoint, and Grafana reads it the same way it reads any Prometheus data source.
Datadog also has a purpose-built integration, covered in depth in the Scalr section of the Datadog provider guide: it streams run events (status, VCS metadata, provider configurations used) and current-state metrics (scalr.runs.count, scalr.runs.failed, and similar) into an out-of-the-box Scalr dashboard. One limitation worth knowing before you rely on it: the Datadog metrics integration sends current-state snapshots only, not historical data, so trend analysis over time needs the OpenMetrics/Prometheus route or Scalr's own Metrics page instead.
Does Terraform Support Distributed Tracing?
Only in early form. OpenTofu added experimental OpenTelemetry tracing in its 1.12 release, tracing the CLI's own execution. Separately, Scalr's self-hosted agents can export OTLP tracing spans, one span per run stage (plan, apply), to any OpenTelemetry collector, Jaeger included, regardless of which Terraform or OpenTofu version the workspace itself runs. That's agent-level tracing (how long each stage of the agent's work took), which is a different layer than OpenTofu's CLI-level tracing, and useful for a different question: whether a slow run is slow because of the plan itself or because of agent startup, provider initialization, or state I/O.
Tracing is the least mature piece of this stack across the board. If you need it today, expect to wire up your own OpenTelemetry collector rather than find a fully managed offering.
What About Audit Trails?
An audit trail is a timestamped record of who changed what, which most compliance frameworks require and which is useful to have even without one. In Scalr, Audit Logs capture user and system activity as immutable records: workspace changes, authentication events, and more. Delivery is either real-time streaming to Datadog or AWS EventBridge, or a 24-hour batch export to your own cloud storage (S3, GCS, or Azure Blob) as append-only JSON.
For what an audit trail actually captures and how to use one for compliance evidence rather than just storage, see a guide to Terraform audit logs.
How Can AI Help With Terraform Observability?
AI shows up in two different places in Scalr, and they solve different observability problems.
Scalr AI works on individual runs. It's off by default, and once enabled at the account scope, it adds three things: an "Explain" button on errored runs that reviews the failure and suggests a root cause and resolution steps (posted as a PR comment for VCS-based workspaces), automatic dry-run summaries that give a plain-language overview of what a plan is about to do, and an optional plan-and-cost summary shown to approvers before they click approve. It only provides recommendations; it doesn't apply fixes itself. Per Scalr's own FAQ, only plan output (not your full infrastructure configuration) is shared with the model, on a shared instance with a zero-day retention policy, and none of it is used for training.
The Scalr MCP Server works across your fleet instead of one run at a time. It connects an MCP-compatible AI assistant directly to the Scalr API, so instead of writing API calls or clicking through dashboards, you can ask something like "which workspaces have detected drift in the staging environment?" or "show me the most recent failed run in production and explain what went wrong," and the assistant pulls from the same runs, drift, workspace, and usage data this post has been describing. Most of what it exposes is read-only; as of this writing, write access is limited to creating workspaces and variables, so it's a query and troubleshooting layer on top of observability data, not a way to trigger runs or approve applies.
The AI Audit Log report, mentioned above, is the observability layer for the AI itself: every interaction gets a timestamp, the user and workspace involved, the operation type, what data context was shared, and a summary of the response.
Where Do You Start?
If you're monitoring nothing today, start with run health: success rate, apply duration, and queue depth, wherever your platform already surfaces them. Add drift status next, since silent drift is the failure mode most likely to turn into an incident. Route both into whatever monitoring stack your team already watches (Prometheus, Datadog, or a platform-native dashboard) rather than building a new one nobody opens. Audit trails come last. They matter just as much, but they usually mean committing to your platform's top pricing tier, and that's a decision to make deliberately.
Frequently asked questions
What is Terraform observability?
Terraform observability is the practice of getting visibility into what your Terraform and OpenTofu runs are doing across a fleet of workspaces: run success and failure rates, plan and apply duration, drift between code and live infrastructure, module and provider version freshness, and an audit trail of who changed what. It's the IaC-specific version of the metrics/logs/traces model applied to infrastructure pipelines instead of application code.
Does Terraform have built-in observability features?
The open-source Terraform and OpenTofu CLIs have logging (the TF_LOG environment variable) and, as of OpenTofu 1.12, experimental OpenTelemetry tracing. Neither ships fleet-level dashboards, metrics export, reports, or audit trails on its own; those come from a management platform layered on top, such as Scalr, HCP Terraform, or a competing TACO platform.
Can I export Terraform run metrics to Prometheus or Grafana?
With Scalr, yes: the OpenMetrics endpoint exposes account-level gauges (run counts, queue size, concurrency, and more) in the OpenMetrics text format, which Prometheus and any Prometheus-compatible scraper can consume directly. From there, Grafana reads it the same way it reads any Prometheus data source.
Does Terraform support distributed tracing?
Not in the open-source CLI in a stable way yet. OpenTofu added experimental OpenTelemetry tracing in the 1.12 release. Separately, Scalr's self-hosted agents can export OTLP tracing spans for each run stage (plan, apply) to any OpenTelemetry collector, including Jaeger, independent of which Terraform version the workspace runs.
Can AI help with Terraform observability?
Yes, in two ways within Scalr. Scalr AI explains errored runs and summarizes plans for approvers on a per-run basis, using only plan output (not full infrastructure configuration), with recommendations only and no auto-applied fixes. The Scalr MCP Server lets an AI assistant query runs, drift, and usage data across your whole fleet in plain language; it's mostly read-only, with write access currently limited to creating workspaces and variables.
About the author

director of platform engineering at Scalr
Ryan Fee is the director of platform engineering at Scalr, with over 15 years of experience improving infrastructure experiences at companies large and small.
Part of this guide
4 sheets