Introducing Scalr Metrics
Track, analyze, and optimize your IaC performance. Scalr Metrics provides critical data on run times and bottlenecks.

If you manage an Infrastructure-as-Code (IaC) pipeline, you eventually need to know how fast it actually runs. Slow Terraform runs cost developer time and money, but tracking down where the time goes used to mean digging through run histories by hand.
Scalr Metrics shows you that performance data directly. It surfaces run timing across all your workspaces, so teams can spot the slow ones and figure out why before they become a problem.
Scalr Metrics: Core Features and Purpose
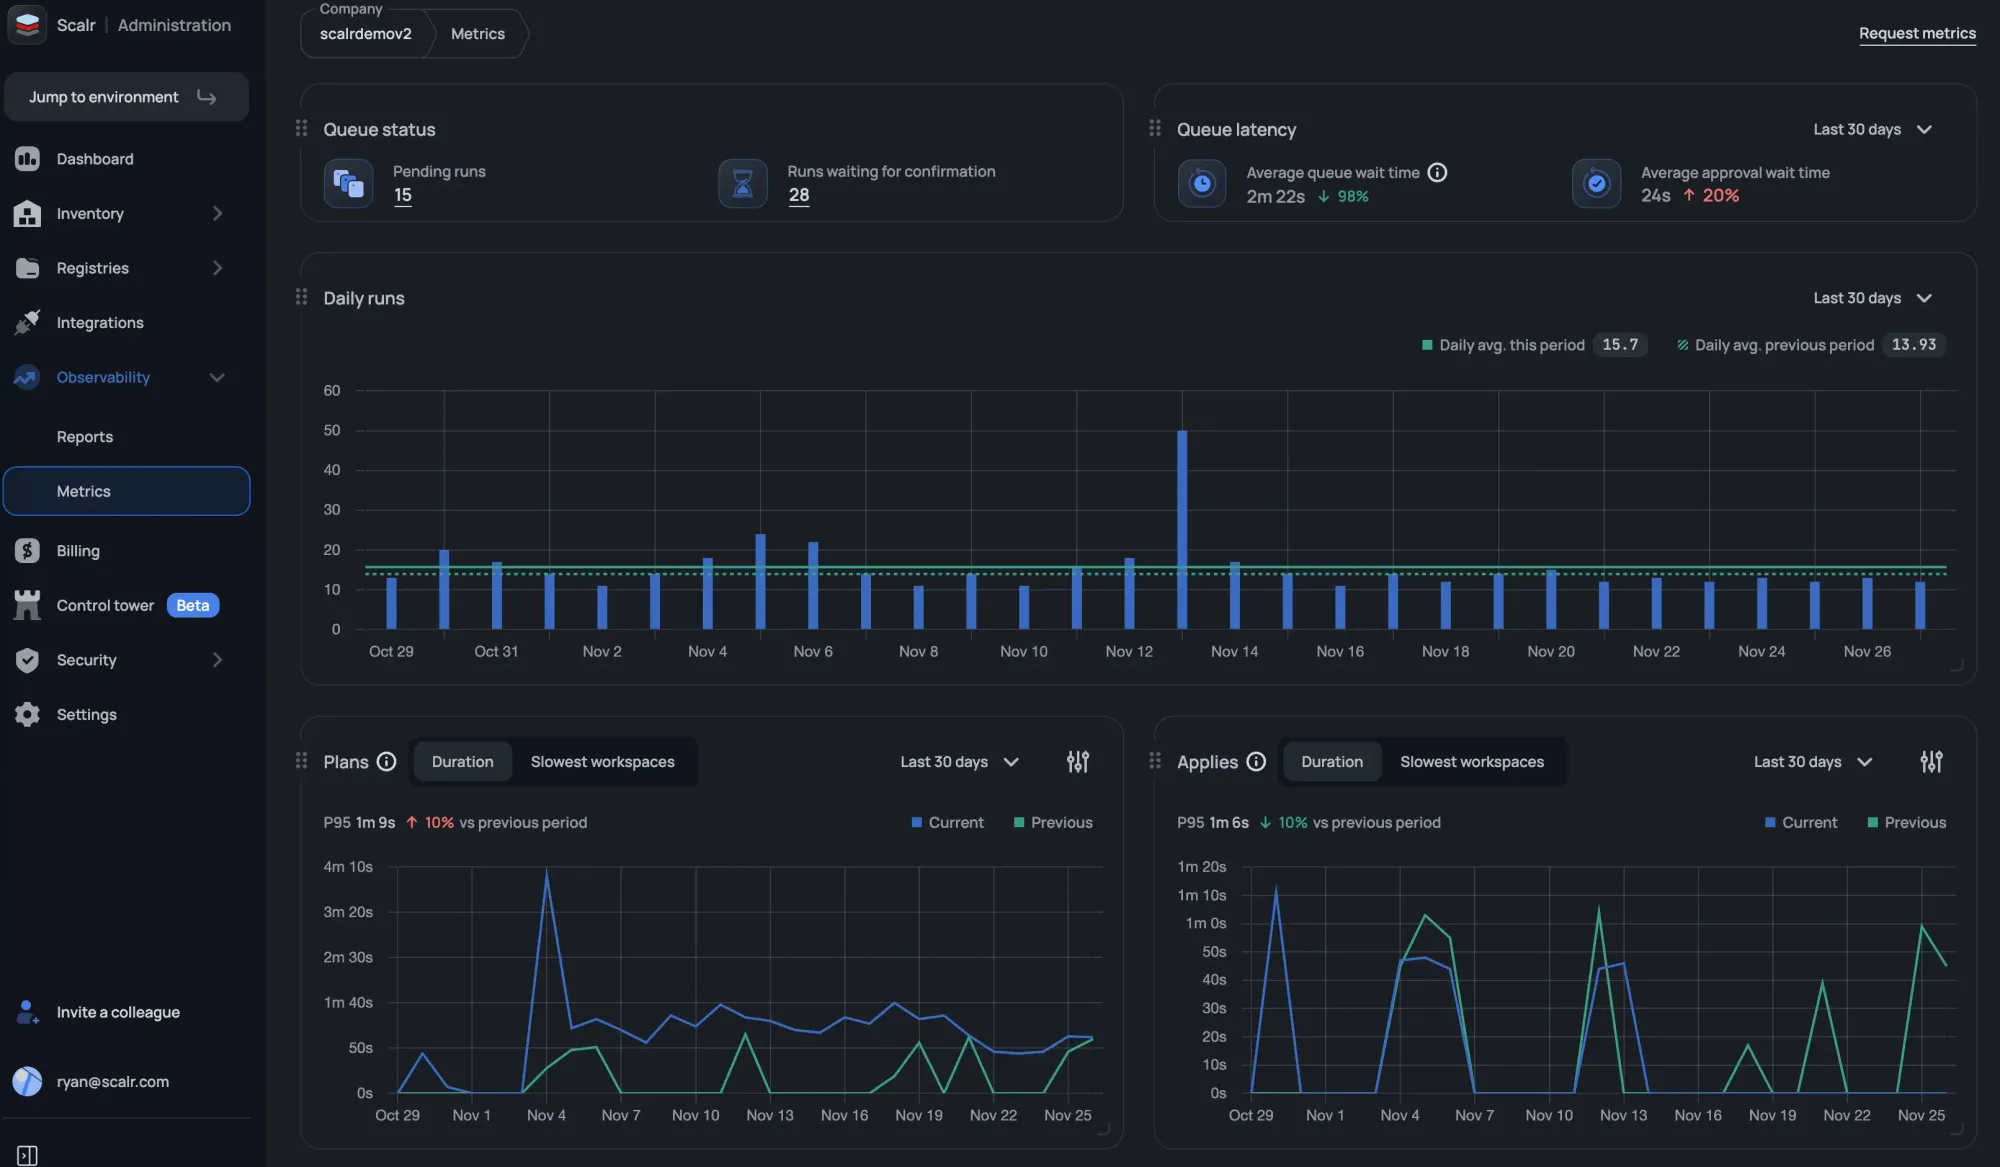
Scalr Metrics turns raw run execution data into performance indicators you can read at a glance. It works from your historical run data, so the picture builds up over time.
You'll find the Metrics feature in the Admin scope under the Observability section. It tracks indicators tied to how long your runs take.
Key Metrics Available:
The following metrics are available in the initial release:
- Apply duration trends (7, 30, and 90-day views)
- Plan duration trends (7, 30, and 90-day views)
- Slowest workspaces impacting apply performance
- Slowest workspaces impacting plan performance
- Daily run statistics
- Pending runs
- Runs waiting for confirmation
- Average queue wait time
- Average approval wait time
This is just the starting point; in the future, you will see data around the average time runs are waiting for approval, total runs in queue, drift detection metrics, and more! Filtering by environment and tags will also make it easier to remove lab or development workspaces that potentially skew the metrics.
Benefits of Using Scalr Metrics
Here's what engineering and platform teams get out of it:
- Identify Bottlenecks: Easily pinpoint workspaces with consistently long execution times to investigate potential causes, such as resource count or provider configuration issues.
- Validate Changes: Use historical duration trends to objectively measure and confirm the performance impact of module updates or configuration changes.
- Proactive Optimization: Continuous monitoring of run duration trends enables teams to address performance degradation proactively, minimizing wait times for developers.
How to Access Scalr Metrics
To get started, open the Observability section in your Admin Scope.
For more detailed information on setup and usage, please refer to the official documentation:Scalr Metrics Documentation